


Vital Statistics
July 30, 2007: on Year Two, Weeks Fourteen and Fifteen — Activity at this site declined to a record low last week.
In part (I think) this was due to the fact that this is the height of yearly meeting season; many of my Quaker readers have been too distracted by meeting duties to check in.
In another part, it was due to the fact that I haven’t posted anything new in some time. I’ve been thoroughly distracted by yearly meeting duties myself!
The number of unique visitors to this site dropped to 1145 last week, the lowest total since March 24 - 30. The number of subscribers to the earthwitness journal dropped to 146, the lowest total since February 16. And the number of subscribers to The Quaker Magpie Journal dropped to 127, the lowest total since May 4.
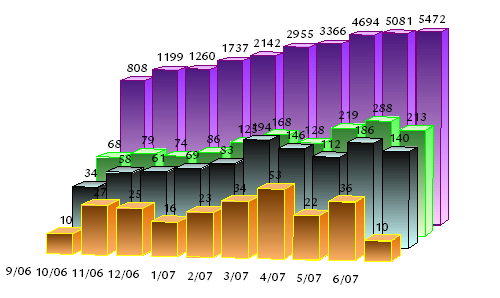
Here’s the weekly chart:
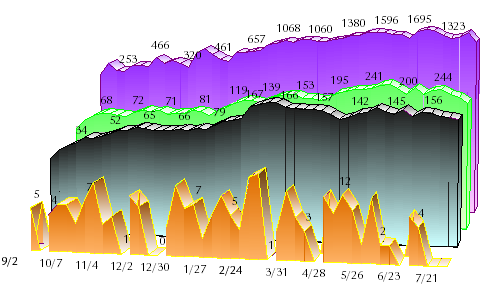
The dates shown at the bottom are the dates when each week began. Thus, the first week shown was that of September 2 - 8, 2006. The latest was July 21 - 27, 2007.
The purple ridge, in back, shows the total number of people who visited this web site in each given week — not the total number of visits, which is larger, but the total number of visitors.
The green and black-and-bluish-white ridges chart the number of RSS subscribers to each of my two journals: The green ridge represents the number of subscribers to the earthwitness journal and the black-and-bluish-white ridge the number of subscribers to The Quaker Magpie Journal.
The orange ridge, in the front of the graph, charts the number of comments that visitors post to this site each week.
The vertical axis of this graph is logarithmic, which makes the distance between 10 and 100 the same as the distance between 100 and 1,000. The effect of using a logarithmic scale is to emphasize proportions rather than sheer numbers: this graph suggests, in effect, that a movement from 10 to 50, or vice versa, is every bit as important as a movement from 100 to 500, or vice versa.
…And here’s the latest monthly chart. All color coding is the same.